
Yves here. The topic Galbraith discusses here, which is the US claims repeated by Paul Krugman that they have achieved much higher productivity levels and therefore higher living standards, is more important than it might seem. This is an important feature of the US that is different, that we have a better and more productive economy. The level of rent-seeking, from our pork meat manufacturers to more expensive and more expensive medical care to paying for higher education, the idea that the US is more productive doesn’t stand up to scrutiny.
By James K. Galbraith, Lloyd M. Bentsen Jr. Chair in Government and Corporate Relations, University of Texas at Austin. Originally published on the website of the Institute of New Economic Thinking
The response to Paul Krugman’s recent essay on US and European productivity raises a broader question. If standard metrics point in conflicting directions, perhaps the problem lies less in economics than in the metrics themselves.
In a July 5 story about economic performance in Europe and the United States, Paul Krugman compares two metrics, real GDP per capita over time and a series of Purchasing Power Parity income ratios. He notes that they give inconsistent results: one shows the US leading the way, the other shows Europe keeping pace. He asks, “Which of these stories is true?” In answering this question, Krugman ignores the possibility that the correct answer is, “none.”
Consider Krugman’s Chart 1, according to which the “average” American is more than sixty percent richer, in real terms, in 2026 than in 2000, the peak year of the Internet boom. Sixty percent. That’s in “real” terms, meaning food, clothing, cars, houses, vacations, sporting events… jobs. Really? Meanwhile, average weekly wages have increased, according to St. Louis Fed, just 10.5 percent.[1] Krugman’s number is either false, or skewed by a skewed income distribution to make it meaningless. Or maybe, both.
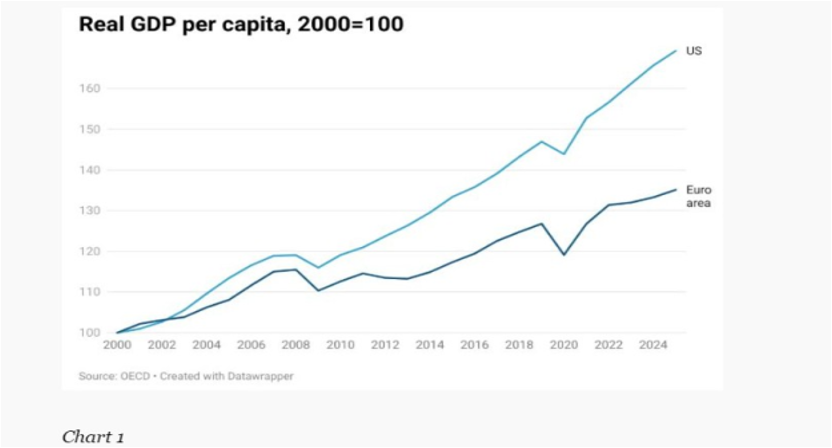
Krugman touches on an important fact when he notes the contribution of the technology sector to US productivity growth rates, and the driving role of strong price adjustments in producing higher measured rates of “real growth” in technology. But why is US tech productivity so high? Krugman writes that the US has “most or all of the technological production.” Really? Taiwan Semiconductor Manufacturing Corporation can not count? And what about the 250,000 working for FoxConn in Shenzhen? Could it be that US tech production is related to the fact that US tech companies (like Apple) are outsourcing dirty work to China, keeping high value-added work at home? It’s not like there are many different ways to make a semiconductor; In fact, there are different ways to organize a supply chain.[2]
On the subject of technology pricing, Krugman writes that his Chart 6 was the fixed price of a “new” product – smartphones. But that’s not the case. The caption reads: “telephone hardware, calculators, and other consumer information devices.” This upsets the idea that the smartphone is “new.” Indeed, i the parcel it is something new in recent decades. But everything I do – telephone, fax, post, camera, tape recorder, TV, calculator, newspaper, magazines, video games, meetings, travel agent, banking – existed and had its counterpart a hundred years ago. The measured price drop comes from the cost of all those different gadgets, now bundled into a package. Major European technology companies are contributing to China, but the share is smaller than what was happening to US companies.
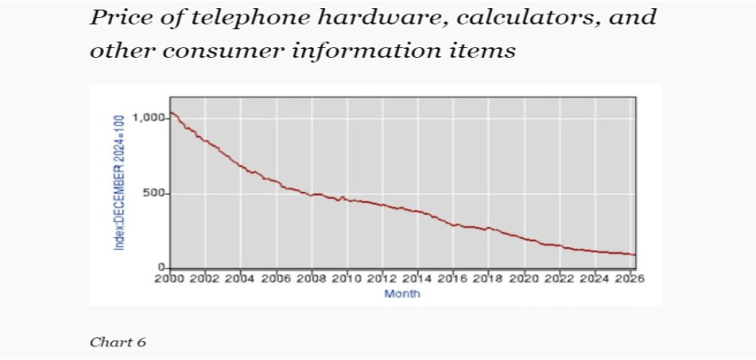
So, sure, the value of all those things has gone down, and if you consider them to still have the same weight in consumption as they did in 2000, we all look (somehow) richer. But all those activities have as little economic value today as they did four centuries ago.[3] When you start from for today basket of consumers, that is, from the benchmark that will be finally accepted, you will find that the technical objects are now forming small ones share of our budgets (and GDP) than before, and their weight in the index after the benchmark revision will be less. Today’s salary goes to many things More they are more expensive than in 2000: energy, education, rent, insurance, interest, human resources – the list is long. And that is the real paradox of information technology: great progress is disappearing in the manufacturing we call our economy. Therefore, they also end up being blurred in the output data. This is called the index number problem; it is a puzzle, and there is no perfect solution. What we do know is that using base year instruments creates exaggeration.
To explain his other measure, purchasing power of equity, Krugman refers to the “Big Mac Index,” – the value of what he calls “the most common commodity sold around the world.” Except it isn’t. In the US, McDonalds is a roadside fast food joint, an old artifact of highway culture. In Europe, as any tourist knows, it’s usually close to the local cafe. Restaurants are experiences, so the Big Mac on those two continents is not the same – and that is very different from the European VAT and public health policies, and their impact on European prices. Despite the withdrawal of the International Comparison Project, PPP comparisons are fraught with such quality problems.
Krugman is a Europhile who believes in the old formula of regressive taxes and massive social benefits, and apparently he thinks this formula still works. I think he was not warned, as I was in Greece in 2010, “don’t go to the public hospital, you will go in a coffin.” He may not have visited French universities where the faculty have no offices and the stalls have no toilet paper. I wonder if he has tried traveling, recently, on German trains, lost thanks to the “credit brake.” Not to mention the wait on Britain’s National Health Service or the aging state of the railways. Capturing all these qualitative differences in the PPP ratio is, well, almost impossible.[4]
Krugman is right to say that the comparisons he enumerates use “absolutely standard methods.” I’m not criticizing statisticians who struggle to measure economic outcomes in a changing world. The problem is that the methods are not up to the task.[5]
However, a little understanding can help. If ordinary Americans were fifty percent richer in 2024 than they were in 2000, would Donald Trump be President today? If “Europe” had not been stagnant, would Germany’s AfD, France’s RN, and UK’s Reform be in power? There is something clearly wrong with measures that show the US at a time of unparalleled prosperity, and equally with measures that show Europeans – though less wealthy – enjoying the same level of improvement in their lives. Economists with their noses in these numbers should, perhaps, get out more.
So what about the US and Europe? And no one is really poor, although the differences across Europe – between Denmark and Portugal, say, or Sweden and Bulgaria, are much greater than those in all the American states.[6] But anyone who has been there knows that, compared to China, both Europe and the US are comparatively smaller. European and American lives are no longer so special. And China is almost twice as big as Europe and America combined.
In addition, there is a good case in Europe relative the decline is rapid, for now. You can see this in the continued decline of major European industries, especially in Germany and especially in automobiles, chemicals, pharmaceuticals – energy-intensive sectors that have dominated Germany’s exports. The US economy is bolstered, as Europe’s is not, by the Permian Basin, the stock market, and the construction boom in data centers. Europe doesn’t have these sticks, and it has the additional disadvantages of deceptive energy policy, rush to attack, and even more severe Sinophobia than America.[7] These factors, and the better reputation of US Treasury debt as a safe haven, can help explain the decline of the euro against the dollar, which (contrary to Krugman), at least in some eyes, is a real indicator of relative decline.
European economic strategy was blocked by the neoliberal ideology that prevailed during the creation of the Eurozone. This strategy has been a self-defeating exercise for decades. The damage is compounded by Europe’s respect for America’s national goals and its failure to define its interests in the modern world. The idea that Europe only needs more “reforms” (flexible labor markets, later retirement, fewer public services, debt brakes …) and more “integration” is absurd. Europe needs peace with Russia, cooperation with China, and a regional development strategy – aimed at places like Romania and Bulgaria that have stagnated since the collapse of the socialist bloc – a New Deal like the one that saved the American South in the 1930s. For that, and to save its industry from collapse, Europe needs gas and oil from Russia and the Middle East, and for that, it needs to somehow stop the war in Ukraine and the US/Israeli invasion of Iran.
_______
- 1. According to the same source, real family income increased by 16.7 percent in the same period.
- 2. Major European technology companies are contributing to China, but the share is smaller than what was happening to US companies.
- 3. The basic determinants of economic value are scarcity and the level of governance power, both of which have declined in the knowledge sector. This issue is discussed in my book with Jing Chen, Entropy Economics: The Living Basis of Value and Production (Chicago, 2025).
- 4. Quality problems are not unique to Europe; any observer can see similar complaints on the American side. The point is that valuing all the differences in a large part of our economic life that does not involve directly comparable goods and services is an intractable problem, sending teams to write store prices that they cannot solve.
- 5. John Maynard Keynes made a similar point, writing in General Theory that “To say that the output is greater, but the level of prices lower, than ten years ago or even one year ago, is a proposition of the same character as the statement that Queen Victoria was a better queen but not a happier woman than Queen Elizabeth – a proposition without meaning and without interest, but not suitable as a separate calculator. The whole passage, in Chapter 4 “Choice of Units,” should be recorded on the table of all who try to make sense of numbers. Keynes concluded that he should measure “the two fundamental components of value, namely, the value of money and the value of labor.”
- 6. Denmark has roughly twice the per capita income of Portugal, and Sweden has nearly three times the per capita income of Bulgaria. There are no pairs of US states whose median income differences are closer to two to one. As for the super rich, the US has many of them, whose worth is well known. In Europe, they are very smart.
- 7. Which region is suffering the most from devaluation is a question I will leave to Isabella Weber of the University of Massachusetts – Amherst, a well-known expert in this area.